Dylan K. Picart
A Practical Use Case for Targeted Data Retrieval and Analysis
The Importance of SQL and Ordered Data
In educational data analysis, precision and reproducibility are essential. Analysts and data engineers frequently need to query large public databases, such as those from the New York State Education Department (NYSED), to extract the most relevant information.
Structured Query Language (SQL) provides an efficient, transparent, and reproducible way to perform these data extractions. Whether analyzing graduation rates or tracking student proficiency in English Language Arts (ELA) and Mathematics, SQL enables analysts to:
- Filter for specific schools, years, and student subgroups
- Combine data from multiple tables and years
- Order results in a manner suitable for presentation and reporting
Ordering data is particularly important in the education sector, as comparisons across schools and years underpin performance reports, funding decisions, and program evaluations. Sorting by meaningful criteria—such as school, subject, or performance—transforms raw data into clear insights.
The examples below demonstrate how to use SQL in Microsoft Access to retrieve NYSED data for specific schools. Please note that all school identification codes used in these examples have been randomized and do not correspond to actual institutions associated with PWC.
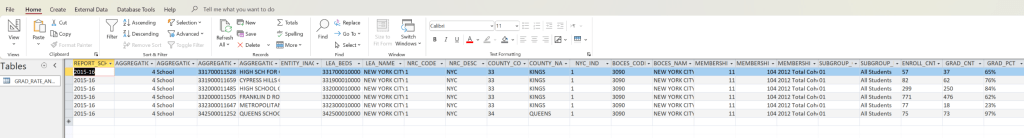
Basic Query: Graduation Rates
The first query retrieves graduation rates for a set of anonymized schools. It filters the dataset to include only “All Students” and a specific institutions denoted by their corresponding BEDSCODE, in this query known as aggregation_code.
SELECT
    *
FROM
    GRAD_RATE_AND_OUTCOMES_2016
WHERE
    CStr([aggregation_code]) IN (
        '342900010251',
        '343000860998',
        '343000010291',
        '343000010084',
        '343000010212',
        '342800010054'
    )
    AND [membership_code] = 11
    AND UCase(Trim([subgroup_name])) = 'ALL STUDENTS'
ORDER BY
    [subgroup_name] ASC,
    InStr(
        1,
        '|342900010251|343000860998|343000010291|343000010084|343000010212|342800010054|',
        '|' & CStr([aggregation_code]) & '|'
    ),
    CStr([aggregation_code]) ASC;
What this query does:
- Retrieves graduation data from
GRAD_RATE_AND_OUTCOMES_2016. - Filters for specific school codes (
aggregation_code). - Limits results to “All Students” within membership category 11.
- Orders the data alphabetically by subgroup and by the sequence of selected school codes.
The ORDER BY clause ensures a consistent and interpretable order. In Microsoft Access, this makes it easier to generate reports or charts comparing schools in a predefined sequence. The InStr() function returns the position of one string within another. It’s often used to check whether a value appears in a longer text sequence. For example, InStr(1, "|A|B|C|", "|B|") returns 3, because “B” begins at the third character of the string. When the substring isn’t found, InStr() returns 0.
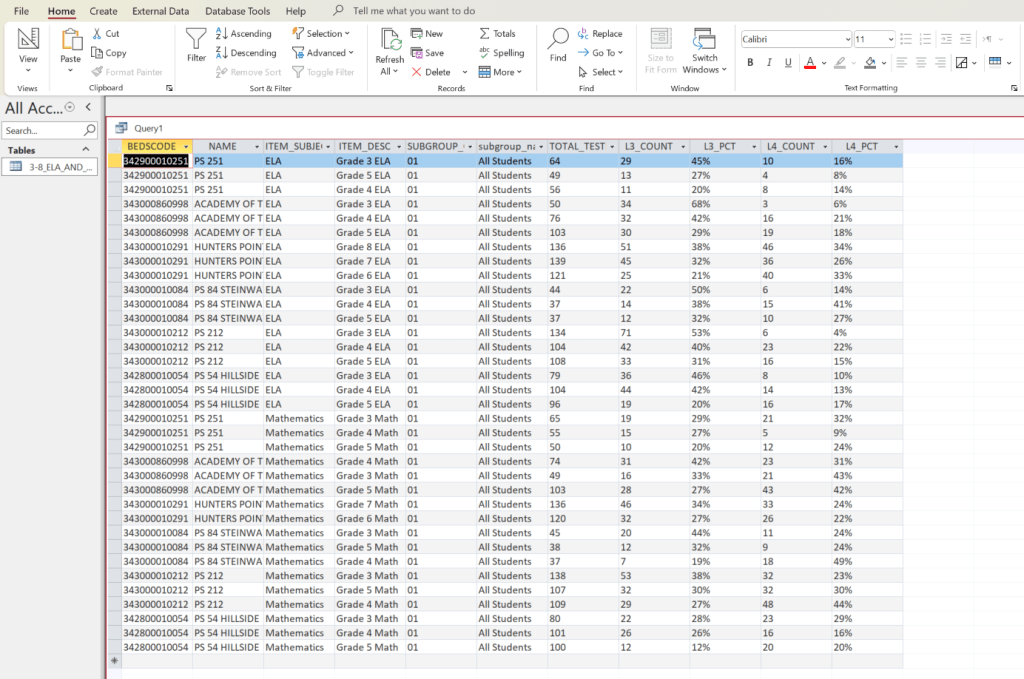
Intermediate Query: ELA and Math Performance
The next query focuses on NYSED’s grades 3–8 ELA and Math exam data. It filters for the “All Students” subgroup and selects only columns relevant to test participation and performance levels.
/*
3-8_ELA_AND_MATH_2021
Filter: SUBGROUP_CODE = 01 (All Students)
Order rows by the specified BEDS codes (anonymized)
*/
SELECT
    [BEDSCODE],
    [NAME],
    [ITEM_SUBJECT_AREA],
    [ITEM_DESC],
    [SUBGROUP_CODE],
    [subgroup_name],
    [TOTAL_TESTED],
    [L3_COUNT],
    [L3_PCT],
    [L4_COUNT],
    [L4_PCT]
FROM
    [3-8_ELA_AND_MATH_REPORT_2019]
WHERE
    Val([SUBGROUP_CODE]) = 1
    AND CStr([BEDSCODE]) IN (
        '342900010251',
        '343000860998',
        '343000010291',
        '343000010084',
        '343000010212',
        '342800010054'
    )
ORDER BY
    [ITEM_SUBJECT_AREA] ASC,
    InStr(
        1,
        '|342900010251|343000860998|343000010291|343000010084|343000010212|342800010054|',
        '|' & CStr([BEDSCODE]) & '|'
    ),
    [NAME] ASC,
    [L3_PCT] DESC,
    [TOTAL_TESTED] DESC;
Highlights of this query:
- Limits results to the “All Students” subgroup (
SUBGROUP_CODE = 01). - Selects only key columns—subject area, test description, counts, and percentages—to improve readability and performance.
- Orders data by subject area, school code sequence, and proficiency levels.
Pulling only the necessary columns improves both query speed and clarity, particularly when exporting results for visualization.
Advanced Query: Building a Layered Data Pipeline in Access
When working with multi-year, multi-subject assessment data, it’s common to need a unified, ordered dataset that can drive longitudinal dashboards or reports. Rather than stacking everything into a single monolithic query, the following example demonstrates how to structure a modular data pipeline in Microsoft Access, similarly to how a Data Engineer would design transformations in a modern ETL environment.
By separating the logic into staging, filtering, and ordered presentation layers, you gain better maintainability, flexibility, and scalability.
A key part of this design is the use of a prefix-based hierarchy for naming queries—stg_ for staging, flt_ for filtered, and ord_ for ordered presentation. This mirrors modern data-warehouse architecture, where datasets flow through distinct layers (staging -> transformation -> presentation). Each prefix signals the query’s purpose and its place in the overall data pipeline, making complex workflows easier to maintain and scale. In practice, this means your Access database can function like a miniature data warehouse—organized, transparent, and ready for growth.
The following steps outline how to build this layered structure step-by-step within Access, from creating a simple ordering dimension to constructing the final ordered query used for dashboards and analysis.
1. Create the Ordering Dimension Table
While effective, the InStr() function becomes harder to maintain at scale, which is why replacing it with a small lookup dimension table is a cleaner, more data-engineering-oriented solution that defines the custom order in which schools appear.
This replaces the need for complex InStr()-based ordering and allows for easy updates later.
CREATE TABLE dim_entity_order (
    ENTITY_CD TEXT(12) CONSTRAINT pk_dim_entity_order PRIMARY KEY,
    sort_order LONG
);
Populate it with your desired school order:
INSERT INTO dim_entity_order (ENTITY_CD, sort_order) VALUES ('342900010251', 1);
INSERT INTO dim_entity_order (ENTITY_CD, sort_order) VALUES ('343000860998', 2);
INSERT INTO dim_entity_order (ENTITY_CD, sort_order) VALUES ('343000010291', 3);
INSERT INTO dim_entity_order (ENTITY_CD, sort_order) VALUES ('343000010084', 4);
INSERT INTO dim_entity_order (ENTITY_CD, sort_order) VALUES ('343000010212', 5);
INSERT INTO dim_entity_order (ENTITY_CD, sort_order) VALUES ('342800010054', 6);
Note: In Microsoft Access, running multiple INSERT statements at once may trigger a “Property not found” or syntax error. This happens because Access executes only one SQL statement per query window. To avoid this, either run each INSERT individually, or combine them into a single INSERT ... SELECT ... UNION ALL statement:
INSERT INTO dim_entity_order (ENTITY_CD, sort_order)
SELECT '342900010251', 1
UNION ALL SELECT '343000860998', 2
UNION ALL SELECT '343000010291', 3
UNION ALL SELECT '343000010084', 4
UNION ALL SELECT '343000010212', 5
UNION ALL SELECT '342800010054', 6;
2. Create a Unified Staging Query
The staging query combines your ELA and Math datasets into one aligned table.
Defining the columns explicitly ensures the UNION ALL runs smoothly, even if field order differs between tables.
SELECT
    [INSTITUTION_ID],[ENTITY_CD],[ENTITY_NAME],[YEAR],
    [ASSESSMENT_NAME],[SUBGROUP_NAME],
    [TOTAL_COUNT],[NOT_TESTED],[PCT_NOT_TESTED],
    [NUM_TESTED],[PCT_TESTED],
    [LEVEL1_COUNT],[LEVEL1_%TESTED],
    [LEVEL2_COUNT],[LEVEL2_%TESTED],
    [LEVEL3_COUNT],[LEVEL3_%TESTED],
    [LEVEL4_COUNT],[LEVEL4_%TESTED],
    [NUM_PROF],[PER_PROF],
    [TOTAL_SCALE_SCORES],[MEAN_SCORE]
FROM [Annual EM ELA]

UNION ALL

SELECT
    [INSTITUTION_ID],[ENTITY_CD],[ENTITY_NAME],[YEAR],
    [ASSESSMENT_NAME],[SUBGROUP_NAME],
    [TOTAL_COUNT],[NOT_TESTED],[PCT_NOT_TESTED],
    [NUM_TESTED],[PCT_TESTED],
    [LEVEL1_COUNT],[LEVEL1_%TESTED],
    [LEVEL2_COUNT],[LEVEL2_%TESTED],
    [LEVEL3_COUNT],[LEVEL3_%TESTED],
    [LEVEL4_COUNT],[LEVEL4_%TESTED],
    [NUM_PROF],[PER_PROF],
    [TOTAL_SCALE_SCORES],[MEAN_SCORE]
FROM [Annual EM MATH];
Save this query as stg_EM_All.
This acts as the staging layer—combining both subjects into a single standardized dataset.
3. Create the Filtered View
Next, create a filtered query that narrows the data to “All Students” and the two relevant assessments.
This step ensures that filters are modular and don’t clutter the staging layer.
SELECT *
FROM stg_EM_All
WHERE
    UCase(Trim([SUBGROUP_NAME])) = 'ALL STUDENTS'
    AND UCase(Trim([ASSESSMENT_NAME])) IN ('ELA3_8','MATH3_8');
Save this as flt_EM_All_AllStudents.
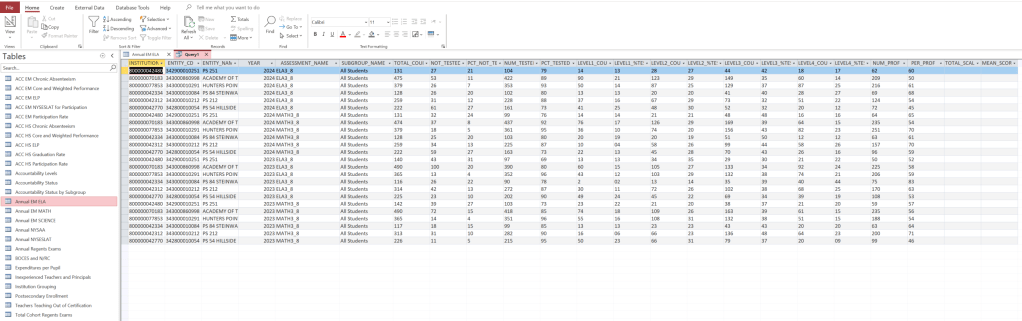
4. Create the Ordered Presentation Query
Finally, join the filtered dataset to the ordering dimension to preserve the desired school order.
This becomes the query for dashboards, exports, and analysis.
SELECT
    f.[INSTITUTION_ID], f.[ENTITY_CD], f.[ENTITY_NAME], f.[YEAR],
    f.[ASSESSMENT_NAME], f.[SUBGROUP_NAME],
    f.[TOTAL_COUNT], f.[NOT_TESTED], f.[PCT_NOT_TESTED],
    f.[NUM_TESTED], f.[PCT_TESTED],
    f.[LEVEL1_COUNT], f.[LEVEL1_%TESTED],
    f.[LEVEL2_COUNT], f.[LEVEL2_%TESTED],
    f.[LEVEL3_COUNT], f.[LEVEL3_%TESTED],
    f.[LEVEL4_COUNT], f.[LEVEL4_%TESTED],
    f.[NUM_PROF], f.[PER_PROF],
    f.[TOTAL_SCALE_SCORES], f.[MEAN_SCORE],
    e.sort_order
FROM flt_EM_All_AllStudents AS f
INNER JOIN dim_entity_order AS e
    ON CStr(f.[ENTITY_CD]) = e.[ENTITY_CD]
ORDER BY
    f.[YEAR] DESC,
    f.[ASSESSMENT_NAME],
    e.sort_order,
    f.[ENTITY_NAME] ASC,
    f.[MEAN_SCORE] DESC;
Save this as ord_EM_All_AllStudents.
Why this approach is effective
- Cleaner structure: Each query performs a single, well-defined task—making debugging and updates straightforward.
- Reusability: The staging layer can feed multiple reports or filters without duplication.
- Custom sorting: The
dim_entity_ordertable centralizes sorting logic, allowing order updates without touching SQL code. - Performance and clarity: Breaking logic into layers mirrors modern ETL design, reducing complexity and making the flow easier to maintain.
- Scalability: Adding subjects or new years of data only requires updates in the staging layer, not the entire query chain.
Connecting Data Design to Transparency and Impact
Designing data workflows this way does more than streamline SQL; it reinforces transparency, reproducibility, and trust in educational reporting. By separating data logic into clear stages, analysts and admins can trace how each number is produced, verify results independently, and adapt quickly when policies or assessments change. This layered approach helps turn raw institutional data into a living system: one that evolves with new information, supports accountability, and makes insights easier to communicate to educators, policymakers, and communities alike.
Conclusion
SQL remains one of the most practical and powerful tools for analyzing educational data. With Microsoft Access, analysts can efficiently query large state datasets, focusing on specific schools or subgroups, and organize data for clearer interpretation.
By understanding how to use filters, unions, and custom ordering, organizations can extract meaningful insights from complex datasets. These techniques not only enhance data-driven reporting within the education sector but are also applicable to healthcare, social services, and nonprofit evaluations and resource allocation.
By combining structured querying with thoughtful data organization, analysts ensure that every dataset tells a coherent story—one that informs decisions, supports transparency, and drives measurable improvement.
Developed at Partnership With Children. All school codes in this article are randomly selected and do not represent actual New York City schools associated with PWC.
